CO-AUTHORS: Ing. Gastón García, Gie Group; Ing. Anibal Márquez, Gie Group.
Synopsis
The tensile strength properties of metallic materials, such as Ultimate Tensile Strength (UTS) and Yield Strength (YS), are the most influential variables when determining the operating conditions to which equipment can be subjected. For various reasons, these data are not always available.
Typically, these properties are obtained from destructive testing of material samples, which is not always viable. As an alternative, an Instrumented Indenter was developed, the ESYS 10, based on Automated Ball Indentation (ABI) technology, which allows for the estimation of both YS and UTS by performing a Non-Destructive Test with the component in service.
There is evidence that the load and displacement values recorded in an indentation cycle are affected by the stress state of the component. This raises the logical question of whether the level of internal pressure to which a pipeline or pressure vessel is subjected could affect the results of the ESYS 10 test.
To answer this question, a series of tests were performed on a vessel at different pressure levels along with a statistical analysis of the results. The results obtained allow us to affirm that the yield strength and tensile strength data obtained with the ESYS 10 do not depend on the stress state of the component being tested, and that the dispersion of the results is within the inherent variations of material behavior.
Introduction
The tensile strength properties of metallic materials, such as Ultimate Tensile Strength (UTS) and Yield Strength (YS), are the most influential parameters when determining the operating conditions of equipment, such as internal pressure or external loads. For various reasons, these data are not always available. Typically, these properties are obtained from tensile tests, which require extracting a material sample to perform a destructive test; this is not always possible because it involves taking the equipment or component out of service, interrupting associated processes, generating loss of profit, and the operations necessary to obtain the sample and subsequent repair. This is, generally, excessively expensive and sometimes impossible to perform, forcing the adoption of excessively conservative estimates in Integrity and Fitness-for-Service evaluations of components.
As an alternative, an Instrumented Indenter has been developed, the ESYS 10, based on Automated Ball Indentation (ABI) technology, which allows for the estimation of both YS and UTS by performing a Non-Destructive Test that can generally be carried out with the component in service [i, ii, iii].
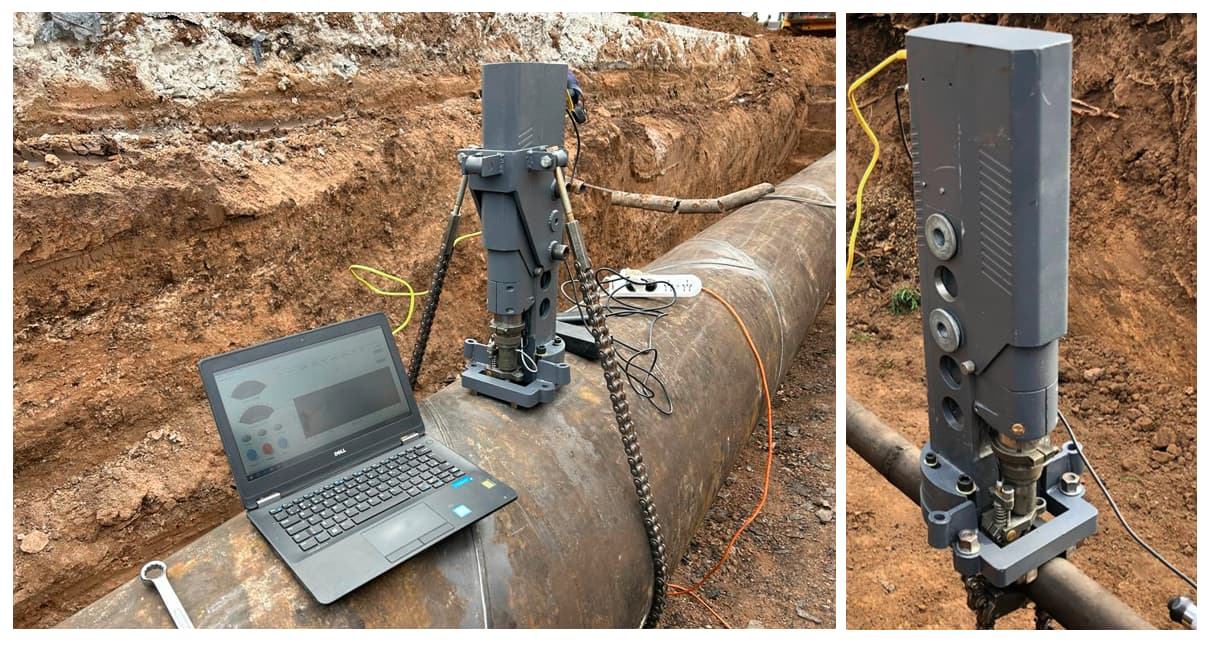
Fig. 1: ESYS 10 Instrumented Indenter, in operation since 2011
The methodology consists of performing an indentation on the metallic surface using a spherical tip, similar to a Brinell hardness test, but in multiple loading and unloading cycles, with simultaneous recording of the load and displacement values of the tip (Fig. 1) [iv, v].
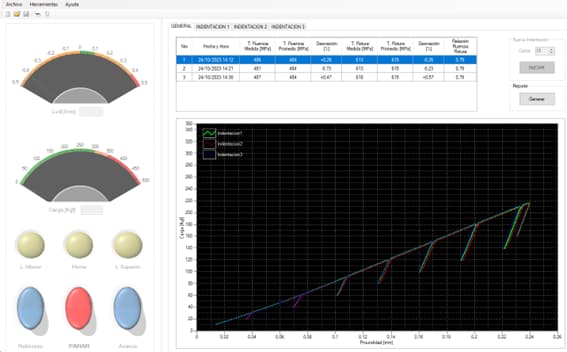
Fig. 2: Load-displacement record during the loading and unloading cycles of the ESYS 10 test
As stated, the main advantage of this technology is that it allows the test to be performed in service, which implies that the components to be tested are normally subjected to various loads, typically internal pressure. There is evidence that the load and displacement values recorded in an indentation cycle are affected by the stress state of the component [vi, vii], to the point that techniques have been developed to estimate residual stresses from this test [viii]. This raises the logical question of whether the level of internal pressure to which a pipeline or pressure vessel is subjected could affect the results of the ESYS 10 test and, if so, in what way (overestimation or underestimation) and to what extent. It should be noted that the analytical models analyzed in the cited works are not applicable to our case due to two fundamental issues. First, the indentation is performed in several cycles, changing the conditions for the following cycle due to the plastification of the area. Second, the data used in the loading algorithm actually come from the unloading cycles, and not the loading cycles.
To answer this question, it was decided to perform a series of tests on a vessel at different pressure levels and conduct a statistical analysis of the results.
Development
Materials and methods
On a metallic vessel manufactured from two 6.35 mm thick API 5L steel pipes and two semi-elliptical heads, indentations were performed with ESYS 10 at 7 (seven) different pressure values, reaching the maximum allowable pressure of the vessel (40 kg/cm2). For each pressure value, between 3 and 10 repetitions were performed. YS and UTS values were recorded as a function of the internal pressure of the vessel, which was measured using a calibrated manometer directly connected to it. The standard error for each pressure level was calculated using the statistical software Infostat. On the vessel material, 3 tensile tests were performed, and the standard deviation of the sample and the error of the mean of all tests performed with ESYS 10 with respect to the mean of the tensile tests were calculated (Table 1). Table 2 and Fig. 3 show the results of the tests performed with ESYS 10.
|
Muestra |
1 |
2 |
3 |
Media |
Desv. Est. M |
Desv. Est. M % |
ESYS |
Error |
|
Yield Stress |
520 |
507 |
510 |
512 |
6,8 |
1,3 |
483 |
-5,8% |
|
UTS |
572 |
567 |
566 |
568 |
3,2 |
0,6 |
602 |
5,9% |
Table 1: Tensile tests on the vessel material versus ESYS 10 Results.
|
Internal Pressure (kg/cm2) |
N |
Average
Yield Stress ESYS (MPa) |
Standard Error YS (MPa) |
Standard Error YS (%) |
Average UTS ESYS (MPa) |
Standard Error UTS (MPa) |
Standard Error UTS (%) |
|
0 |
7 |
480 |
2,7 |
0,6% |
594 |
5,0 |
0,8% |
|
10 |
4 |
488 |
5,0 |
1,0% |
603 |
2,6 |
0,4% |
|
20 |
10 |
485 |
6,4 |
1,3% |
606 |
7,8 |
1,3% |
|
25 |
3 |
485 |
1,9 |
0,4% |
615 |
1,7 |
0,3% |
|
30 |
3 |
479 |
6,6 |
1,4% |
598 |
14,2 |
2,4% |
|
35 |
9 |
484 |
2,0 |
0,4% |
604 |
3,7 |
0,6% |
|
40 |
9 |
478 |
2,1 |
0,4% |
593 |
3,4 |
0,6% |
|
Average |
6,4 |
482,7 |
3,8 |
0,0 |
601,9 |
5,5 |
0,91% |
Table 2: Results of the tests with Esys 10 on the vessel at different internal pressure values
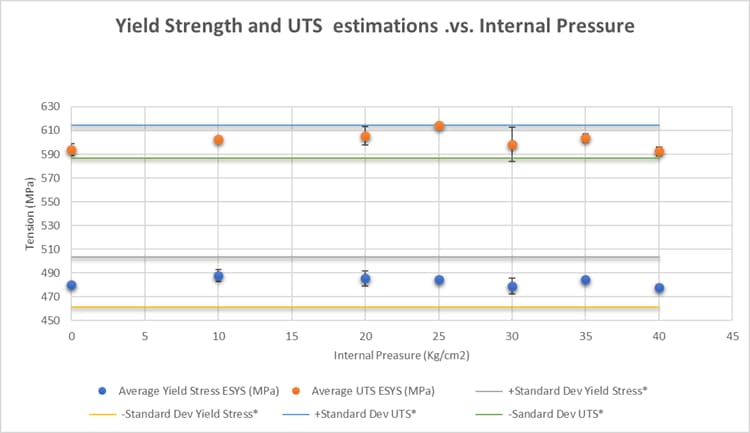
Fig. 3: Mean Yield Strength and Ultimate Tensile Strength for different pressure values. Standard error bars are indicated
Discussion of results
The measured values are independent of the internal pressure value. Furthermore, the maximum standard error is 1.3% with respect to the mean, both for the yield strength and for the ultimate tensile strength (UTS). The percentage error with respect to the tensile test values is 6% for both UTS and YS.
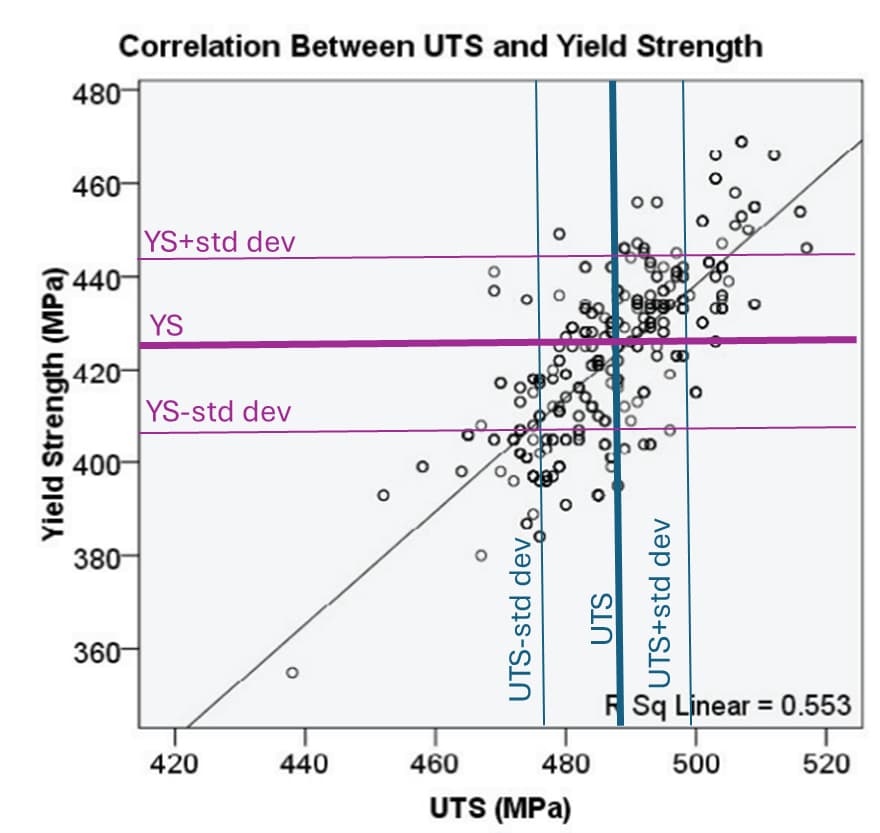
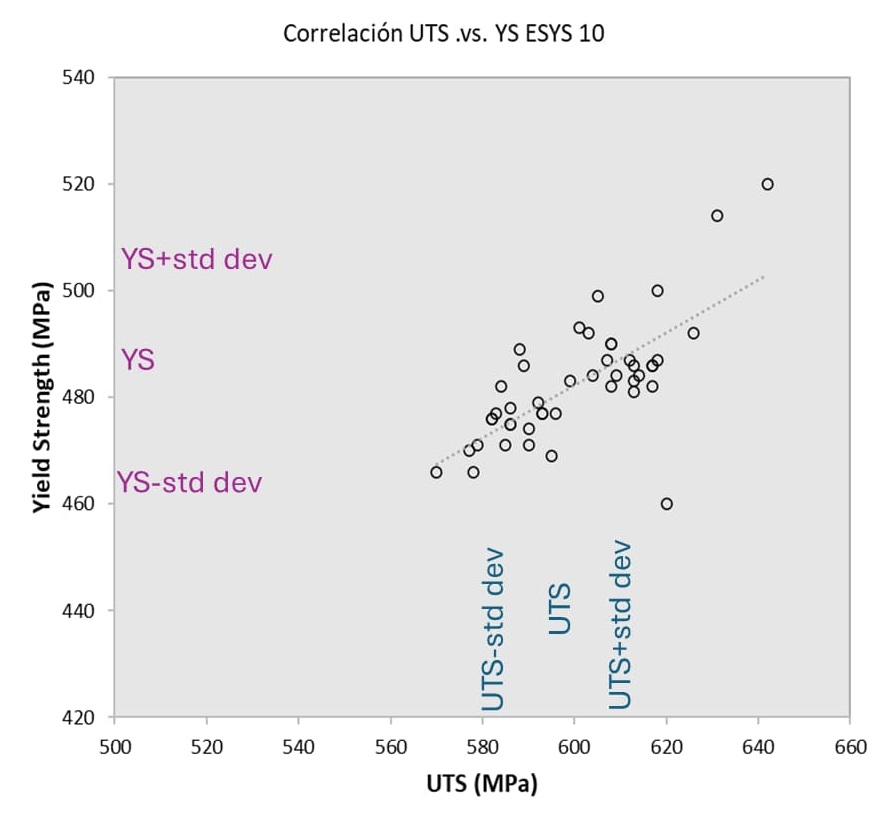
To analyze whether these standard error values are acceptable, the results obtained were compared with those of more than 700 tensile tests performed on different coils of HSLA S355 MC steel, coming from the same hot roller [ix]. In Fig. 4 a), the correlation between yield strength and ultimate strength is shown. The researchers reported a standard deviation of 4.38% for yield and 2.32% for ultimate strength, which is indicated by colors on the graph. In Fig. 4 b), an equivalent graph is shown comparatively with the results of the tests performed with ESYS 10. The values ±2.32% for YS and ±4.38% for UTS are also marked.
Conclusions
The tests performed not only allow us to affirm that the results of the technique (yield strength and ultimate tensile strength) do not depend on the stress state of the component being tested, but also demonstrate that the dispersion of the results provided by the technique is within the variations inherent in the behavior of the materials.
Referencias
[i] J. L. Otegui et. Al, “Desarrollo nacional para la caracterización mecánica no destructiva de componentes metálicos en servicio”, VIII Congreso Regional de ENDE Campana – Agosto 2011
[ii] J. Villca et Al., “Determinación del error del ensayo no-destructivo mediante ESYS 10 en la estimación de la tensión de rotura y fluencia de aceros”, IX Congreso Rregional de Ensayos No Destructivos y Estructurales (CORENDE y Jornadas de Soldadura), 2013.
[iii] M. González et. Al., “ MEJORA DEL OPEX: DETERMINACIÓN EN CAMPO DE PROPIEDADES MECÁNICAS DE MATERIALES MEDIANTE INDENTACION INSTRUMENTADA”, 3° Congreso de Integridad en Instalaciones en el Upstream y Downstream de Petróleo y Gas, IAPG, Mayo 2017, Buenos Aires.
[iv] F.M. Haggag and K.L. Murty, «A Novel Stress-Strain Microprobe for Nondestructive Evaluation of Mechanical Properties of Materials,» Nondestructive Evaluation (NDE) and Materials Properties Ill, ed. P.K. Liaw et al. (Warrendale, PA: TMS, 1997), pp. 101-106.
[v] F. Haggag, Nanstad, R. K., Hutton, J. T., Thomas, D. L., and Swain, R. L., “Use of Automated Ball Indentation Testing to Measure Flow Properties and Estimate Fracture Toughness in Metallic Materials”. Applications of Automation Technology to Fatigue and Fracture Testing, ASTM 1092, A. A. Braun, N. E. Ashbaugh, and F. M. Smith, Eds., American Society for Testing and Materials, Philadelphia, 1990, pp. 188-208. (1990)
[vi] T. Y. Tsui, “Influences of stress on the measurement of mechanical properties using nanoindentation: Part I. Experimental studies in an aluminum alloy”, J. Mater. Res., Vol. 11, No. 3, Mar 1996, https://doi.org/10.1557/JMR.1996.0091
[vii] N. Huber et Al., “On the effect of a general residual stress state on indentation and hardness testing”, Acta Materialia 56 (2008) 6205–6213, https://doi.org/10.1016/j.actamat.2008.08.029
[viii] J. G. Swadener, “Measurement of residual stress by load and depth sensing indentation with spherical indenters” J. Mater. Res., Vol. 16, No. 7, Jul 2001, https://doi.org/10.1557/JMR.2001.0286
[ix] G.W. Bright et Al, “Variability in the mechanical properties and processing conditions of a High Strength Low Alloy Steel, Procedia Engineering , Vol 10, 2011, https://doi.org/10.1016/j.proeng.2011.04.020