Corrosion is one of the most significant challenges in the oil and gas industry, with the potential to cause substantial economic losses and environmental damage. The key to efficient maintenance and proper asset management lies in the accurate prediction of corrosion rates.
In search of solutions to these challenges, we have developed an algorithm that maximizes the information provided by In-Line Inspection (ILI) runs to calculate corrosion rates. This approach is based on the matching of anomalies detected in multiple ILI runs through an automated process based on the characteristics of the anomalies and the characterization tolerances of the inspection tools.

To determine corrosion rates, the developed methodology evaluates data obtained from two ILI runs, estimating the individual growth of each anomaly identified en masse to facilitate statistical data analysis.
Before conducting any local corrosion growth analysis, it is essential to align and bring the corrosion anomalies detected in different inspections to a common reference system. This is because each ILI uses its own coordinate system, making it difficult to compare the measured positions of corrosion anomalies.
To address this challenge, we have developed a process to align coordinate systems and identify correlating anomalies.
The process starts with matching circumferential welds along the pipeline, which consists of three key stages. Initially, a primary match is made based on the coordinates of each circumferential weld. Then, the algorithm evaluates segment lengths and associates them with fittings (such as nipples, valves, etc.) that represent fixed points in the trace, thereby verifying the initial match. This automated matching process undergoes quality verification by an analyst to ensure precision.
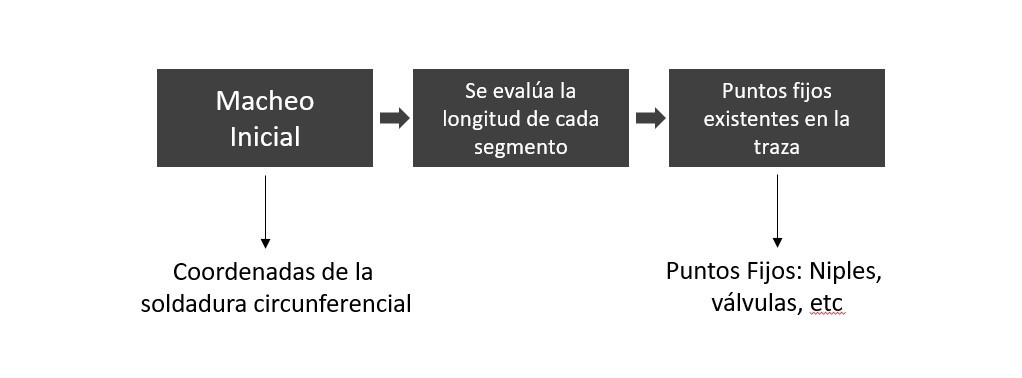
Figure 1: Process for aligning coordinate systems and identifying correlating anomalies
Once we have achieved coordinate system alignment, we carry out a correspondence analysis of each point in set X (anomalies from run 1) with each point in set Y (anomalies from run 2), generating a probability matrix describing the likelihood of matching between the pair of features.

Figure 2: Correspondence Analysis
This probability function takes into account the location of each anomaly (whether external or internal), its classification (e.g., PITT, AXGR, GEN), and the overlap of areas between anomalies, considering geometric features and inspection tool tolerances.
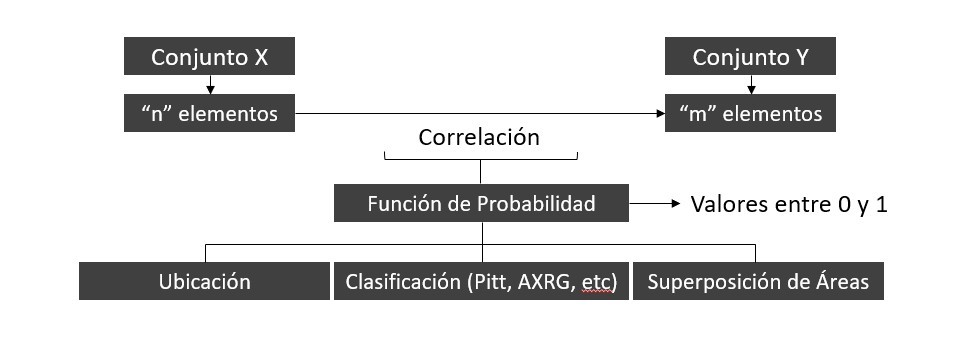
Figure 3: Probability Function
With the probability matrix in hand, we proceed to permutation analysis to identify the combination of values that results in the best match. From this final algorithm, we achieve the definitive matching of anomalies.
| Pik |
K=1 |
2 |
… |
m |
| i=1 |
0.8 |
0.3 |
… |
0 |
| 2 |
0.1 |
0.9 |
… |
0 |
| … |
… |
… |
… |
… |
| n |
0 |
0 |
… |
0 |
Table 1: Anomaly Matching
In summary, our approach, which takes into account geometric features, classification, and anomaly locations, and uses a matrix-based approach with a probability function, has proven to be a solution that enables massive data analysis with a significant improvement in precision and reduced analysis times compared to conventional methodologies.
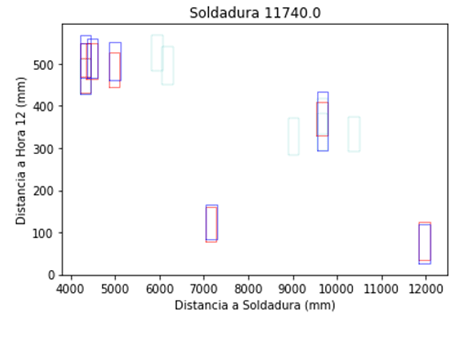
Unlike traditional methods based on manual correlation or list-type comparison algorithms, our algorithm offers a decisive improvement. While manual matching allows for greater flexibility in correlation criteria, it has less traceability and is subject to analyst subjectivity. On the other hand, the possibility of conducting massive comparisons is generally not feasible due to time constraints.
The developed algorithm provides a substantial improvement over the classic list-based analysis approach. In this classic approach, each anomaly from the latest ILI run is compared to anomalies from the previous run, determining a match when it falls within the parameters established in the algorithm. The weakness of this approach is that by not simultaneously comparing all anomalies from ILI 2 with all anomalies from ILI 1, we face the possibility of multiple matches of the same anomaly or correct assignment due to the order in which the comparison loop is performed.
In addition to its precision improvement, this algorithm stands out for its efficiency, allowing the comparison of two runs with 50,000 anomalies in a matter of minutes. This matching of anomalies not only provides higher-quality data for estimating corrosion rates but also allows combining the analysis with artificial intelligence tools to enhance the prediction of failure pressures and time to leakage.
A deeper analysis of the results delivered by ILI leads to optimization of repair plans and a reduction in costs and accidents in the oil and gas industry.


